 PopDash
PopDash
PopDash
Create beautiful, automated dashboards in seconds. No coding required. Save 15+ hours per week and reduce BI costs by 75%.
✓ Free forever plan ✓ No credit card required ✓ Setup in 60 seconds
See how PopDash compares to traditional BI tools
Built for business users who need powerful analytics without the complexity
Upload your data and get a professional dashboard in seconds. Our system analyzes your data structure and automatically creates the perfect visualizations.
Chat with your data in plain English. Ask questions like "Who is my top sales rep?" and get instant, accurate answers with real numbers from your dataset.
Choose from 20+ chart types with professional themes. Bar charts, line graphs, maps, treemaps, and more - all designed to make your data story compelling.
Excel, CSV, Google Sheets, PostgreSQL, MySQL, Salesforce, HubSpot, and 50+ more. Connect your data from anywhere - no complex ETL required.
Keep your dashboards up-to-date with live data connections. Set refresh schedules or trigger updates via API for always-current insights.
Built for business users, not engineers. Create professional dashboards with drag-and-drop simplicity. No SQL, no Python, no problem.
Beautiful dashboards, powerful insights, zero complexity
Create professional dashboards in seconds with intelligent automation
Upload your data and get a complete dashboard instantly
Drill down into your data with powerful dynamic filtering
Connect live data sources and see updates instantly
Ask questions in plain English, get instant accurate answers with visualizations
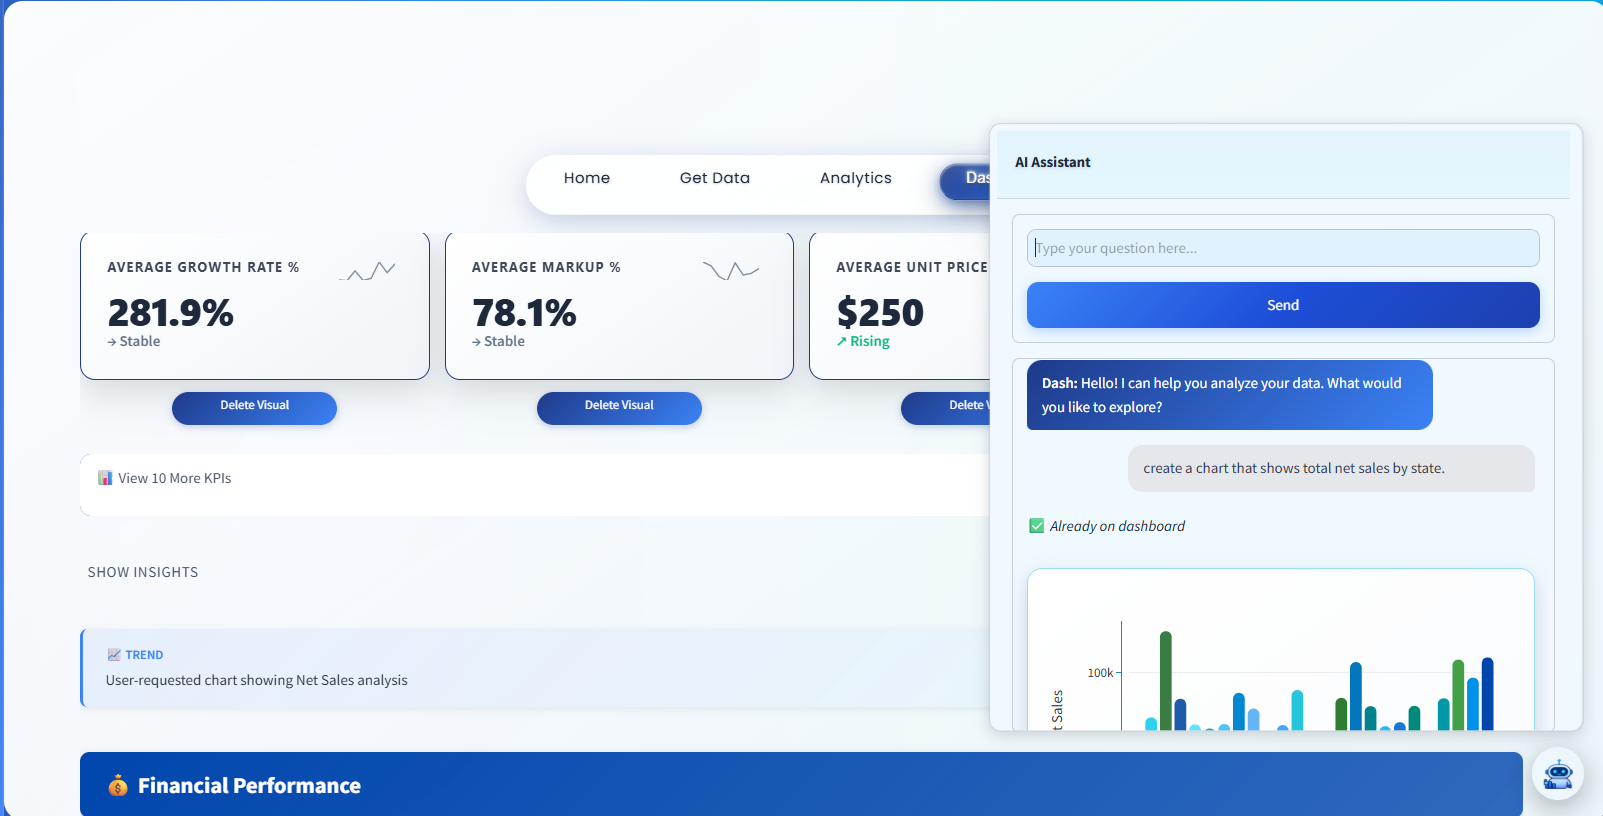
Chat with your data like you're talking to an analyst
Get precise insights backed by your actual data
System automatically creates the perfect visualization
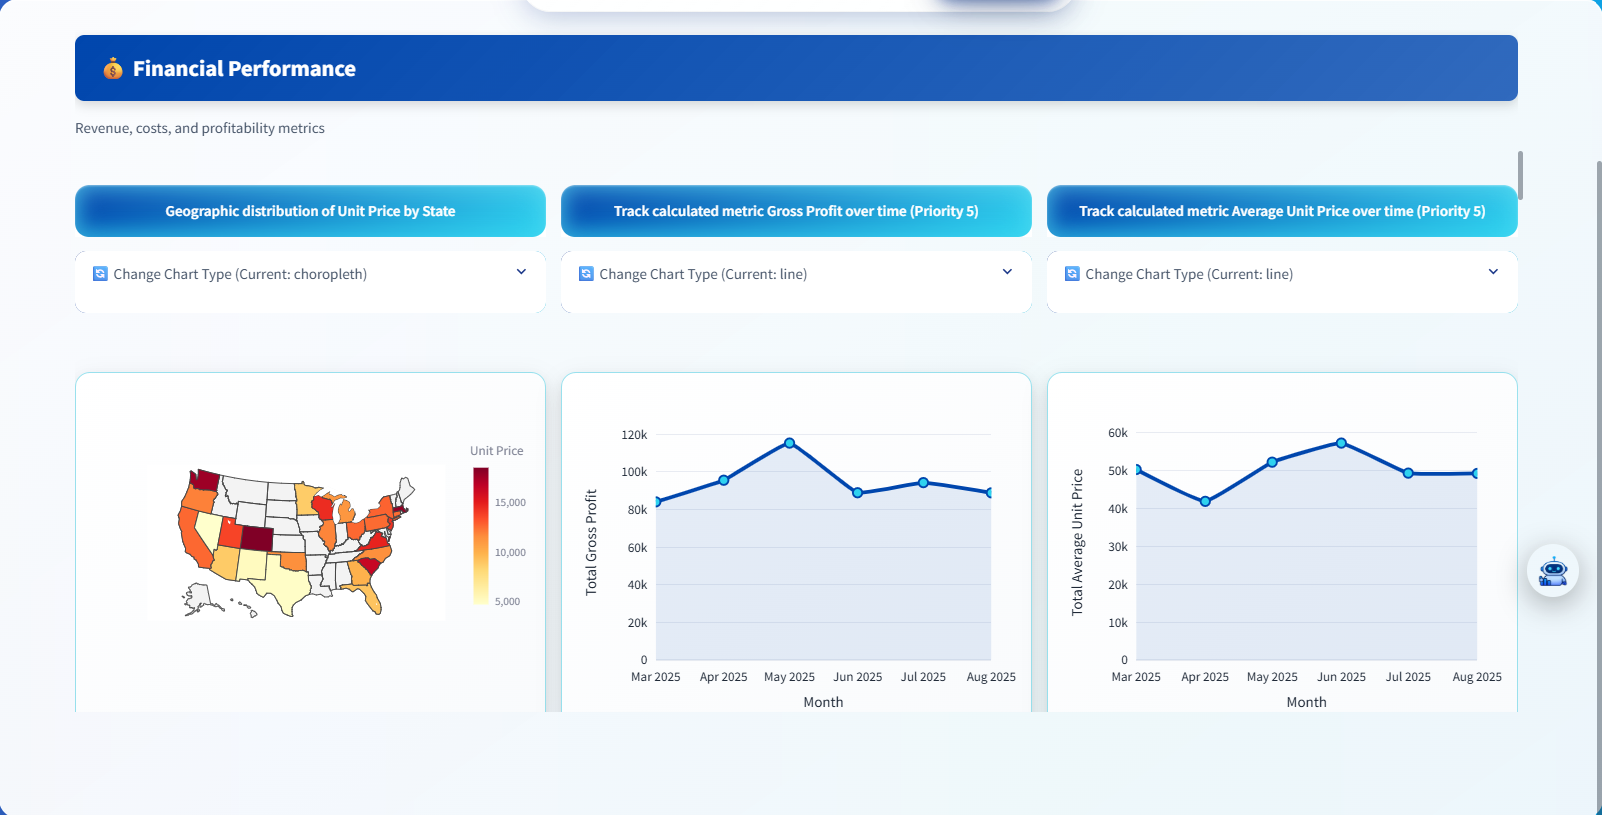
Visualize location data with beautiful, interactive maps
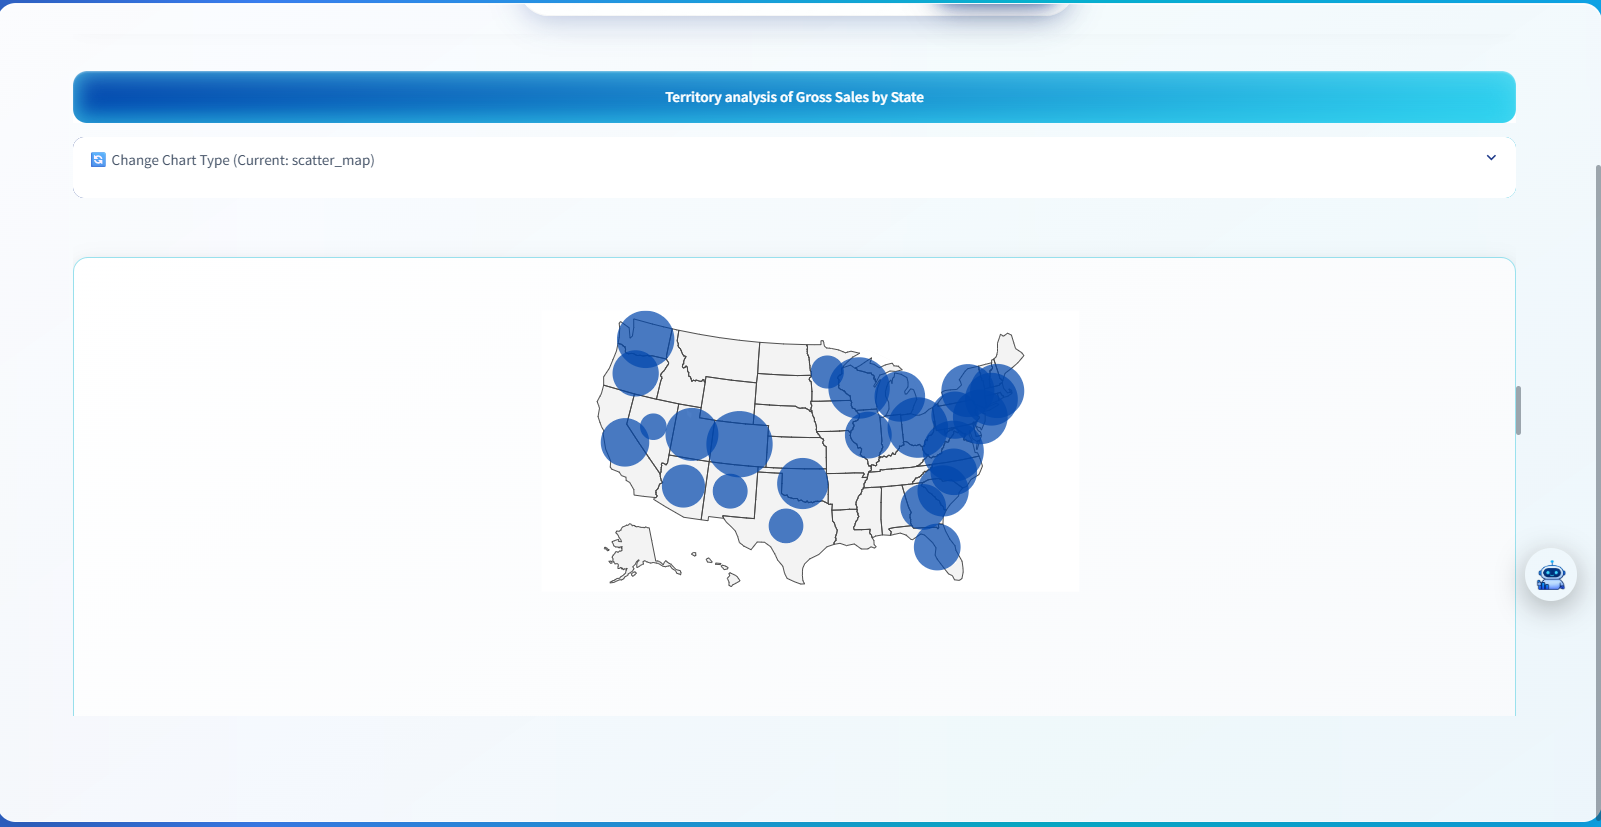
Automatically recognize and map geographic data
Zoom and filter to explore regional patterns
Uncover hidden patterns and correlations in your data automatically
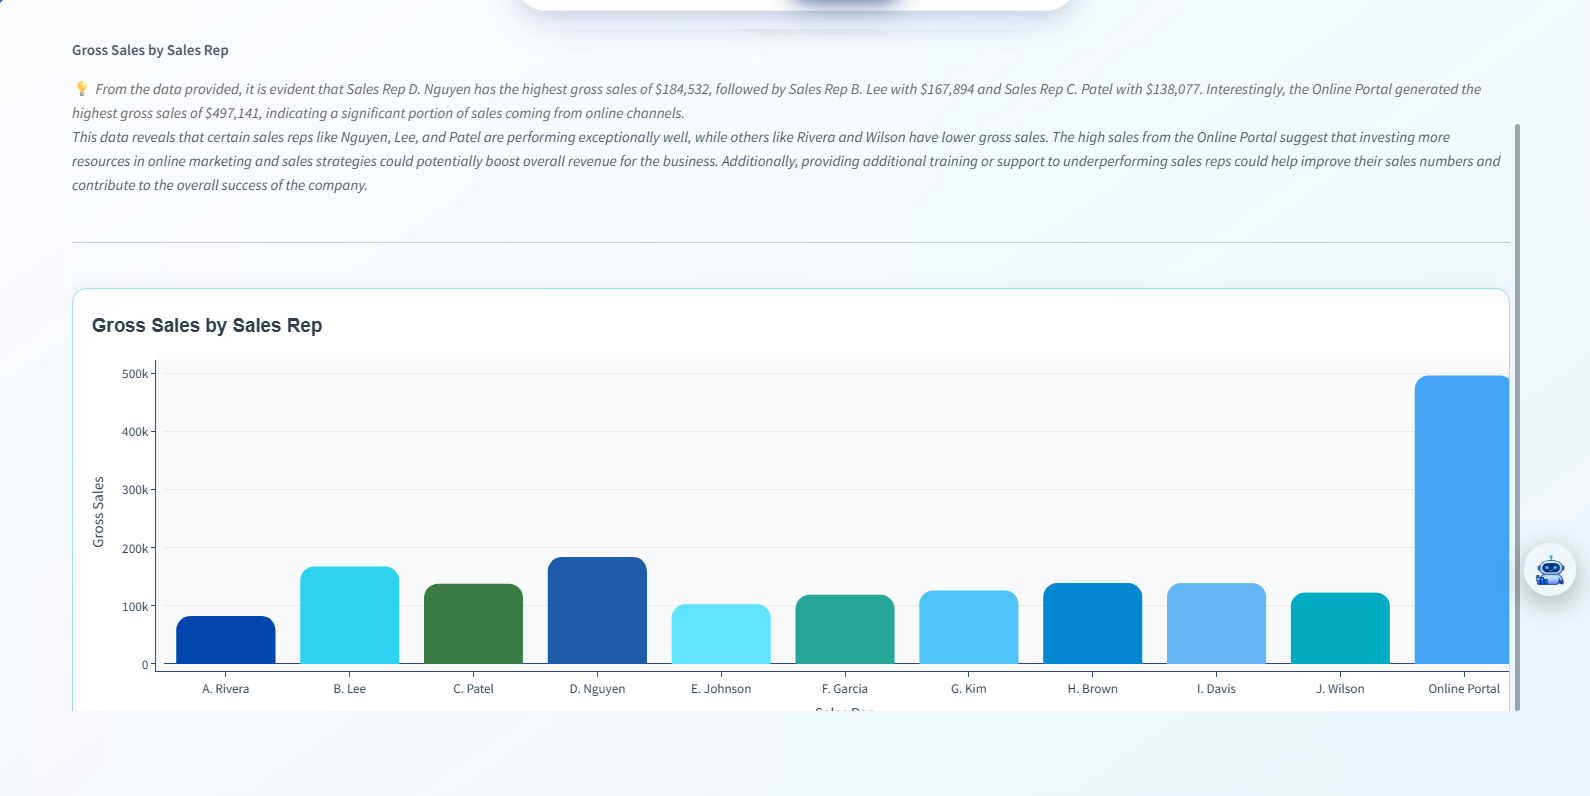
Automated analysis finds patterns you didn't know existed
Discover relationships between different metrics
Spot trends and anomalies automatically before they become problems
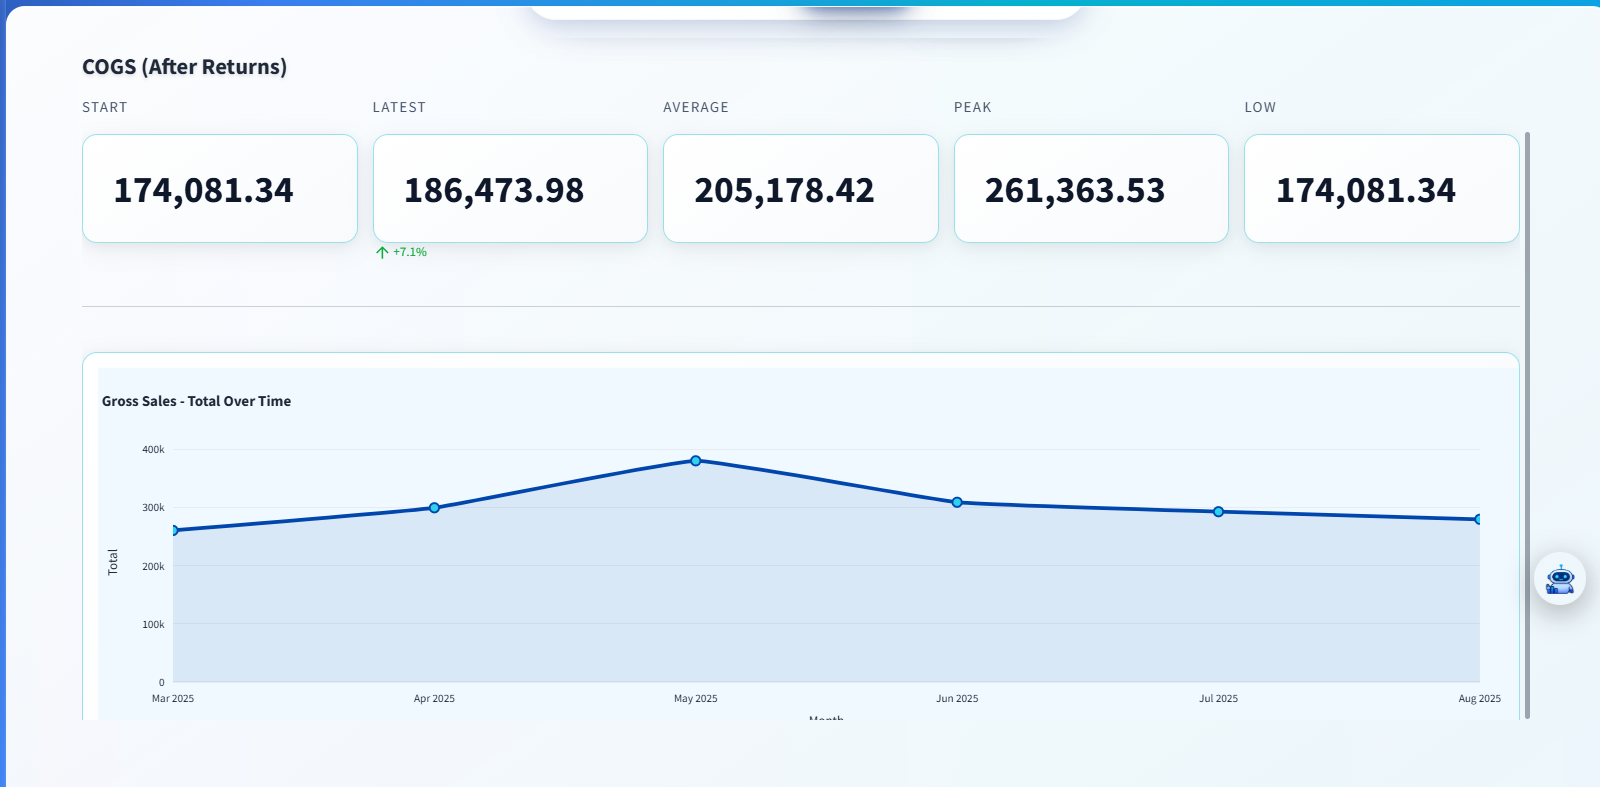
Monitor how your metrics evolve over time
Get notified when unusual patterns emerge
Track what matters most with automated KPI detection and analysis
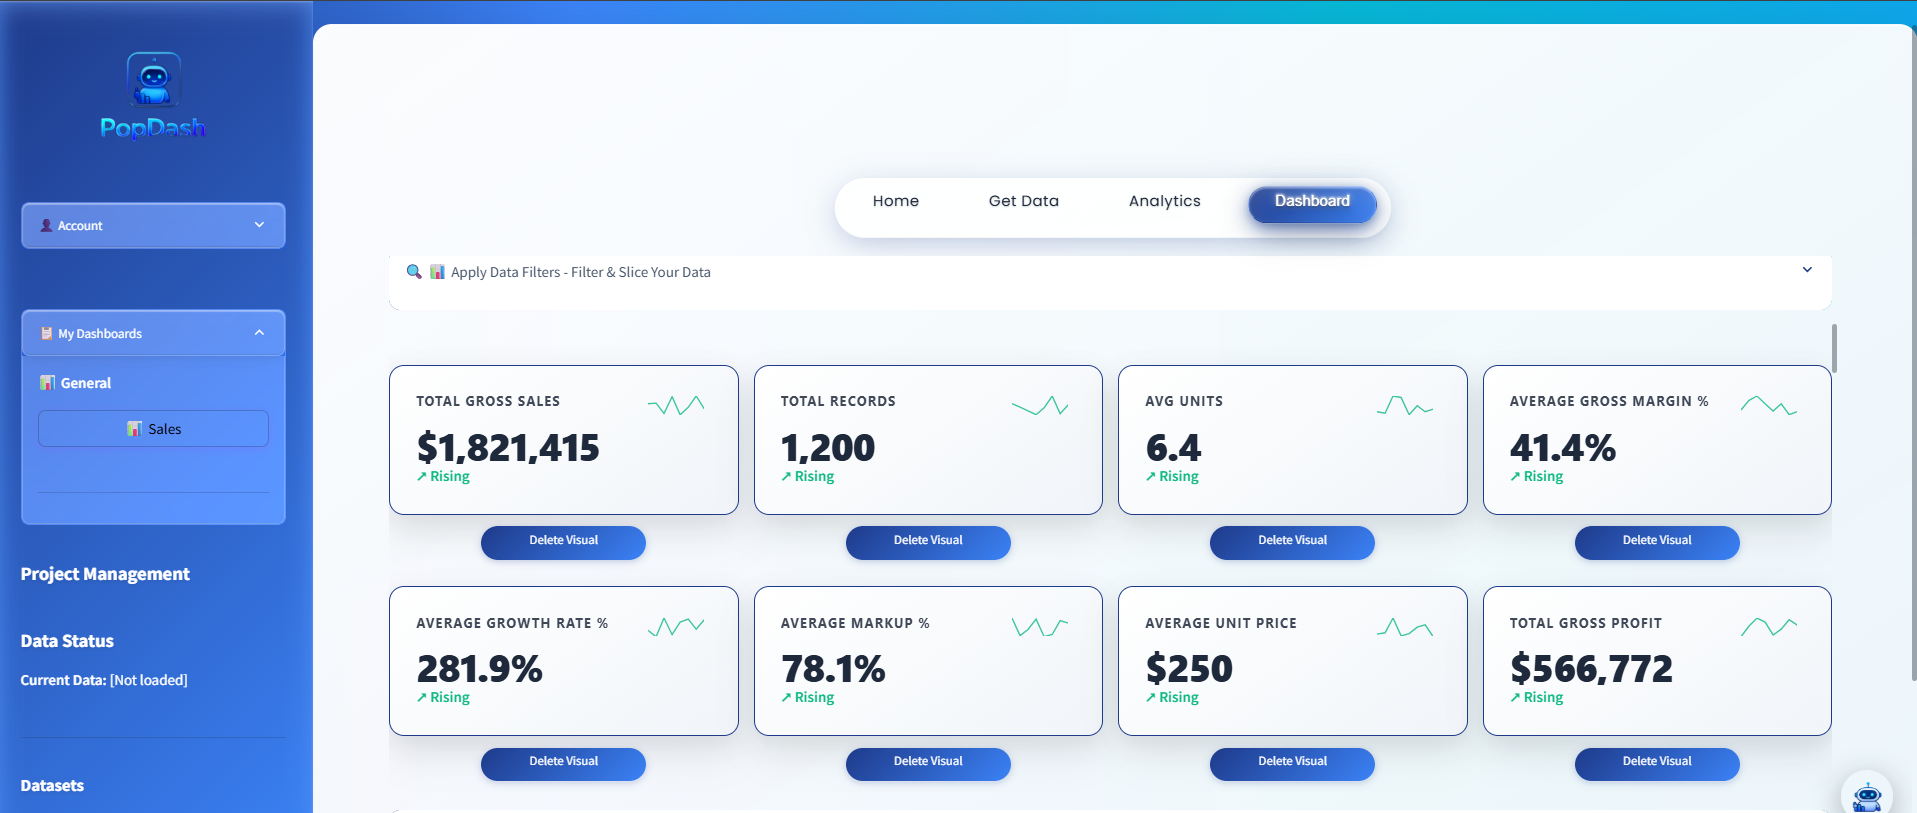
System identifies your most important metrics automatically
See at a glance if metrics are improving or declining
Understand the real business impact behind every metric
See how each KPI affects your bottom line
Get actionable recommendations to improve performance
PopDash doesn't just visualize your data—it analyzes it, finds patterns, and delivers insights you'd miss otherwise
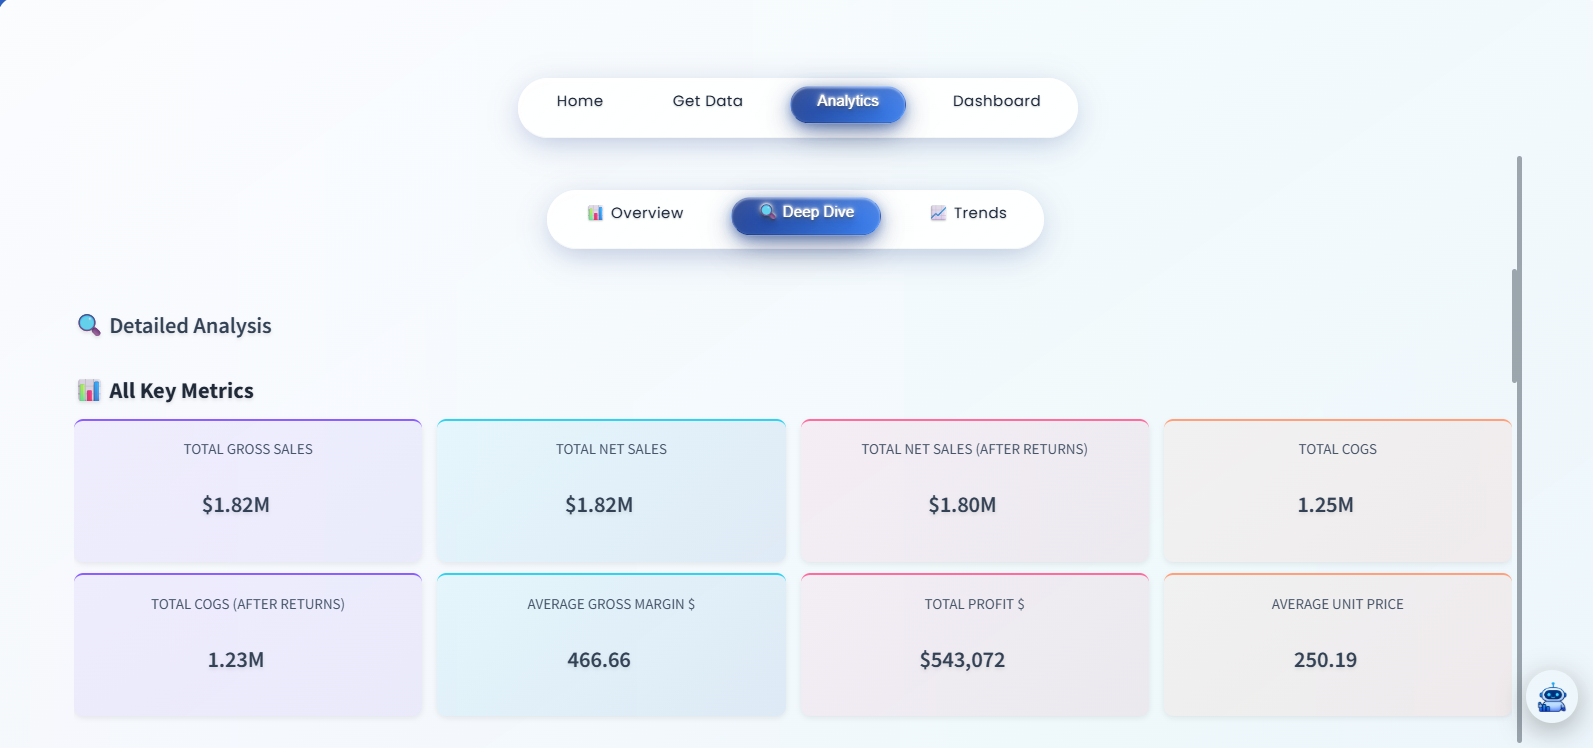
Get instant, comprehensive analysis of your entire dataset. Our system examines every metric, identifies correlations, and surfaces the insights that matter most to your business.
Understand how your metrics change over time with automated trend analysis. Spot opportunities, identify issues early, and make data-backed forecasts.
No training required. No consultants needed. Just results.
Drag and drop your Excel file, connect your database, or link your Google Sheets. PopDash supports 50+ data sources and handles files up to any size.
Our system analyzes your data structure, identifies key metrics, and automatically generates beautiful visualizations. Get insights you didn't even know existed.
Add your company logo, customize dashboard titles, and share with your team. Export to PowerPoint, PDF, or share a live link. Update your data and dashboards refresh instantly.
Track revenue, pipeline, and rep performance in real-time. Identify top performers and opportunities instantly.
Measure campaign ROI, track conversions, and optimize spend across all channels in one dashboard.
Get company-wide KPIs at a glance. Make data-driven decisions with confidence.
Monitor inventory, logistics, and efficiency metrics. Spot issues before they become problems.
Start free. Upgrade as you grow. No hidden fees.
Perfect for individuals and small teams
For growing teams and businesses
For large organizations with advanced needs
Join 10,000+ businesses using PopDash to make better decisions with their data.
Get Started FreeNo credit card required • Free forever plan • Setup in 60 seconds